
All photos

Bell System telephones
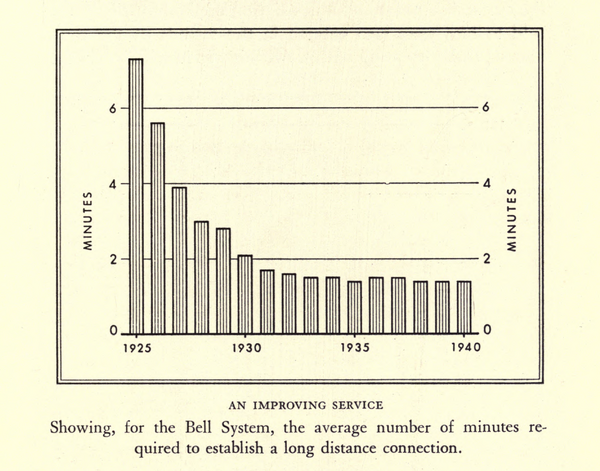
Long distance connection times
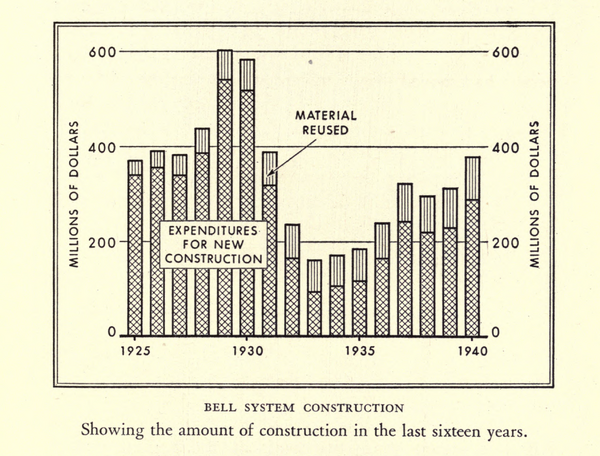
Construction expenditures
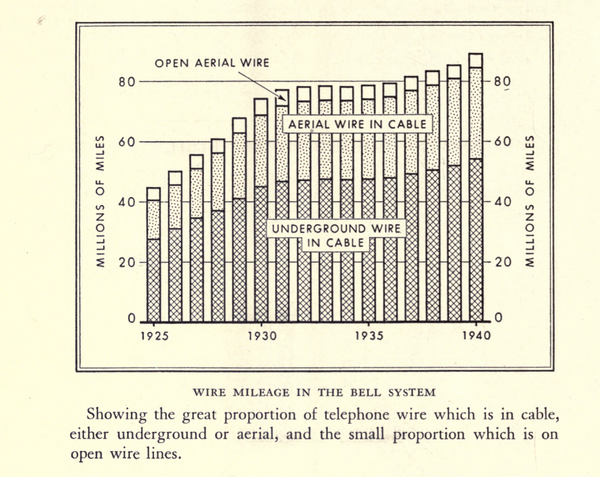
Underground cable vs. aerial wire
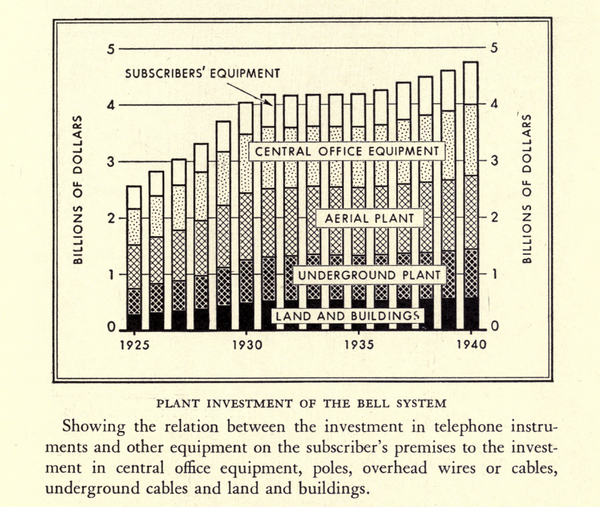
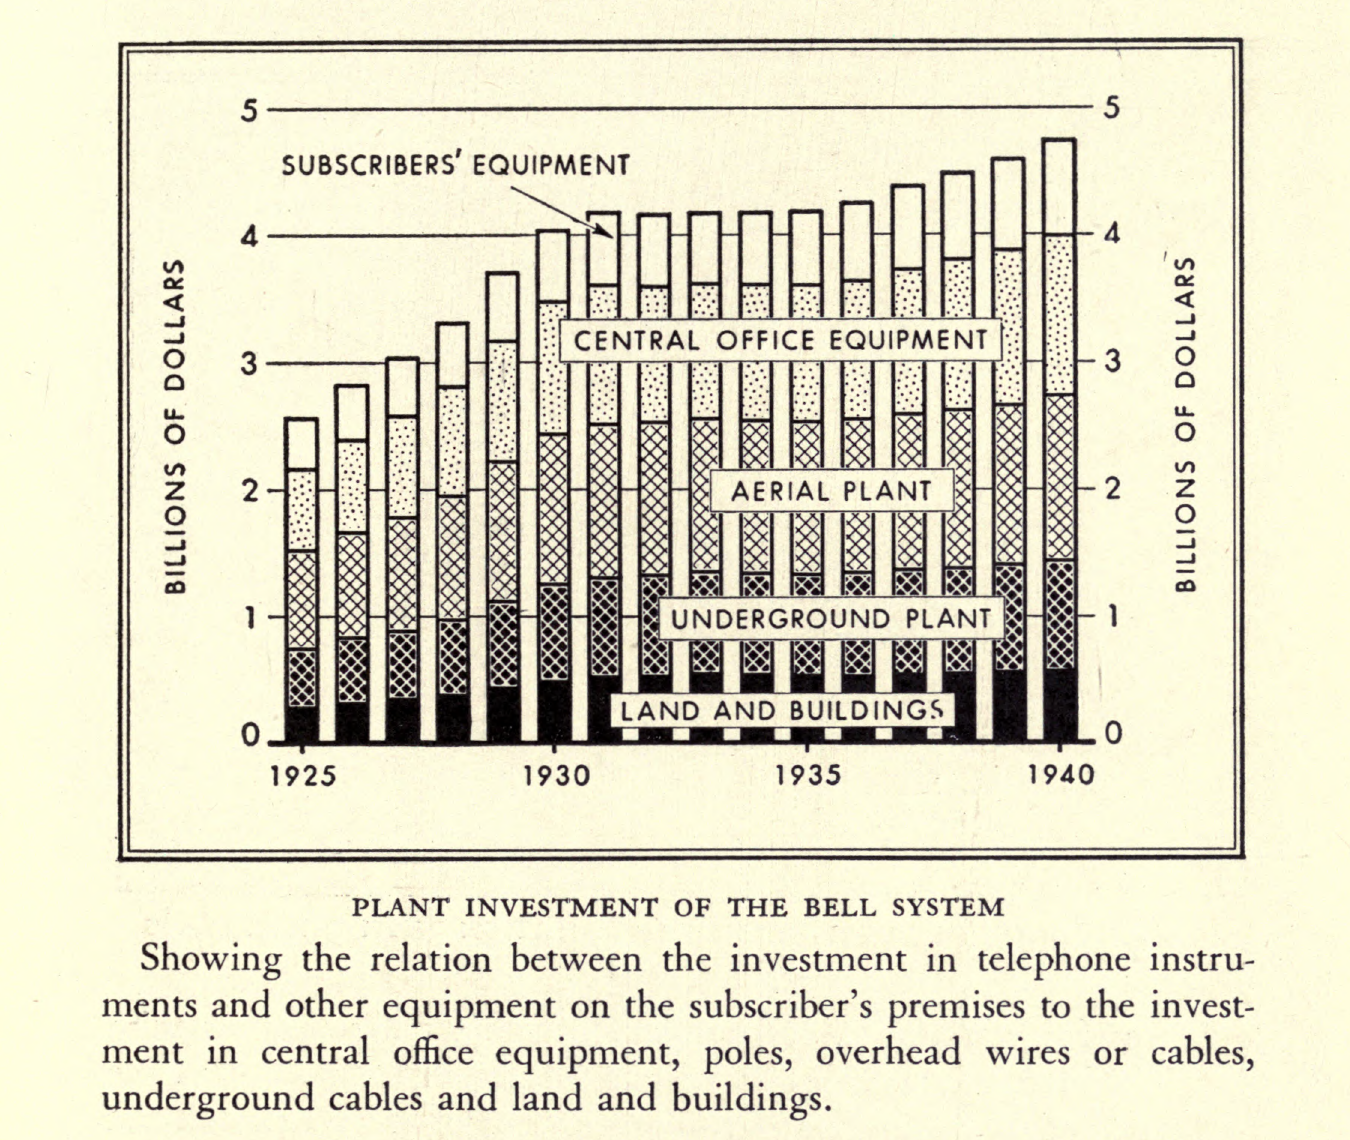
Plant investment by type
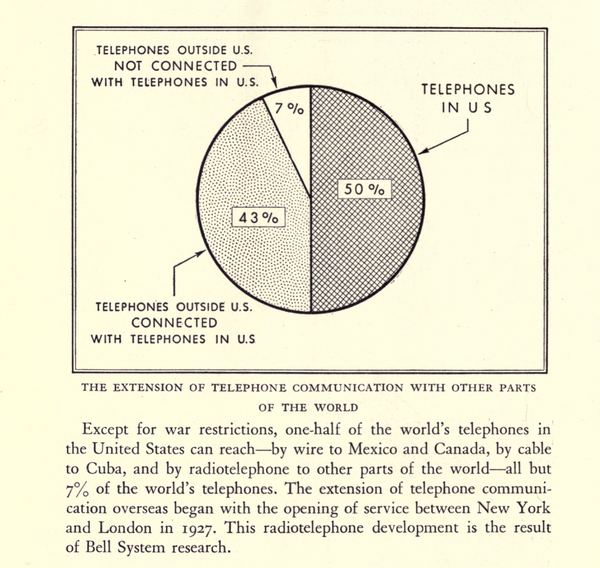
Global connectivity
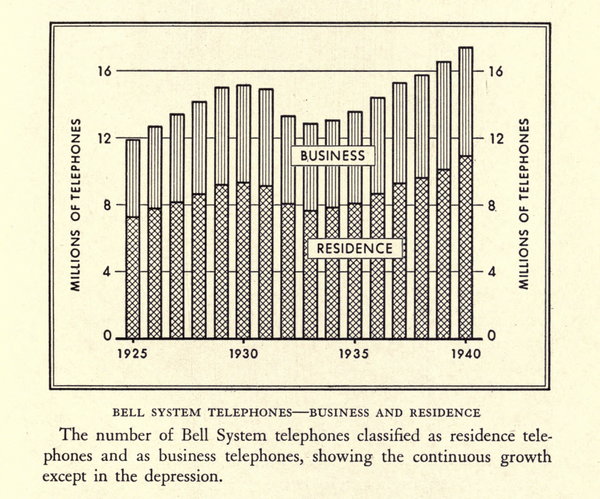
Residence vs business phones
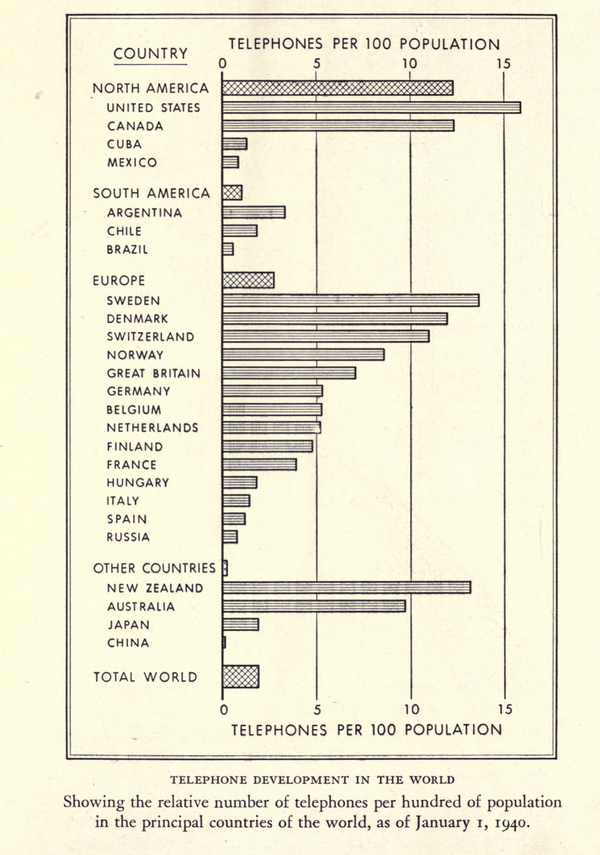
Global phones per 100 population
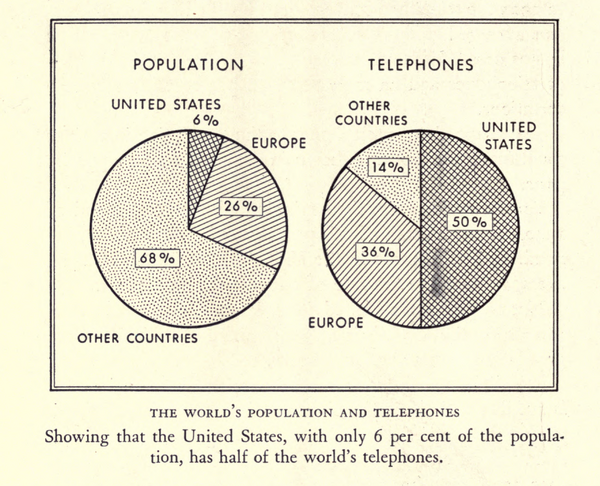
U.S. has half the world's phones

Long distance rates comparison 1925 vs 1940
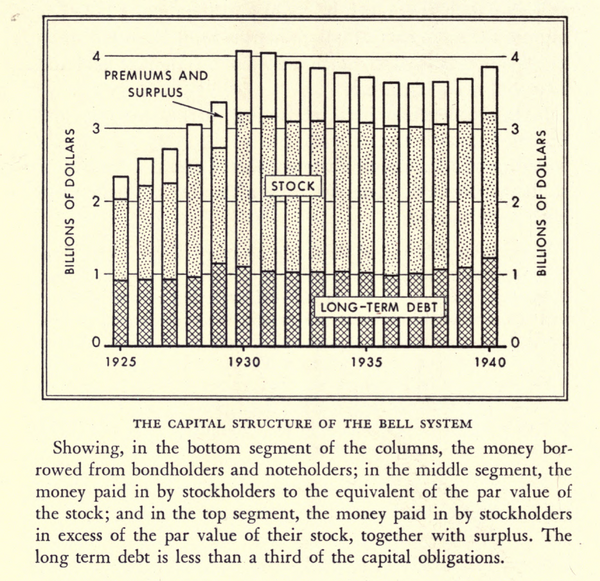
Capital structure (debt vs equity)
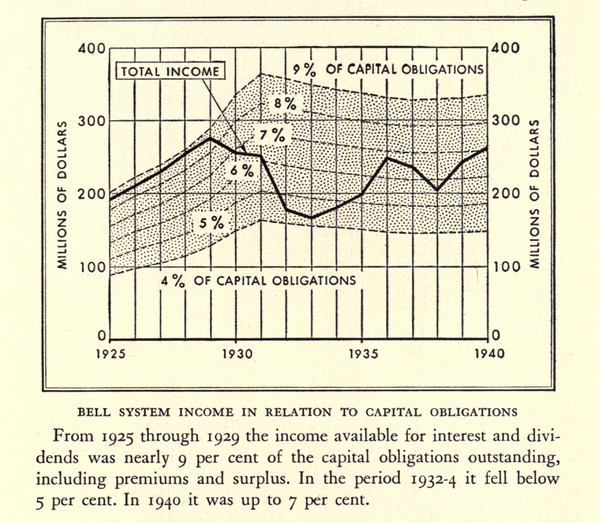
Return on capital
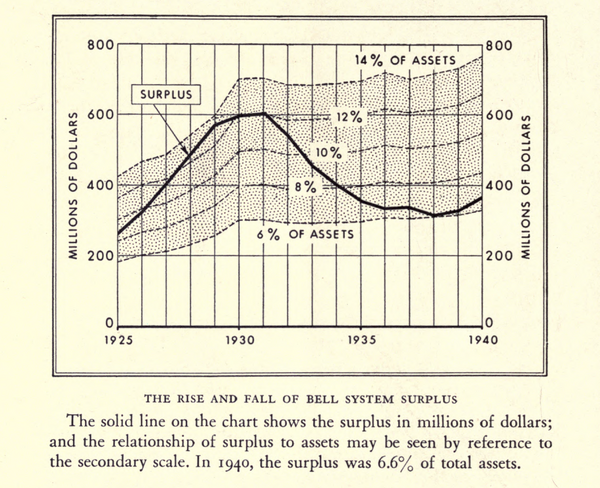
More return on capital
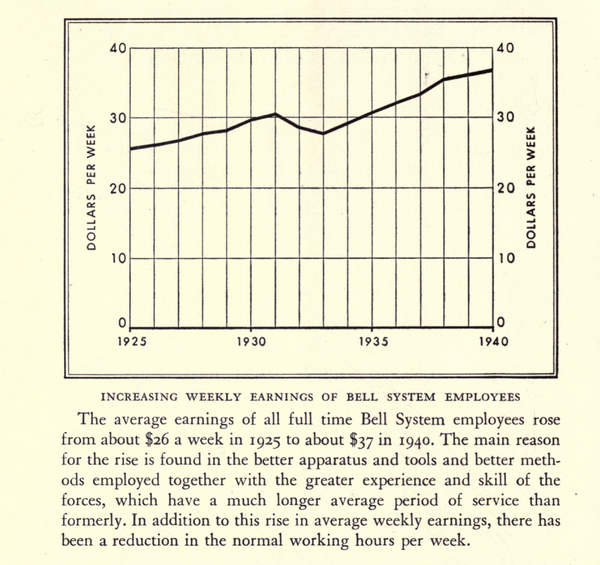
Employee average earnings
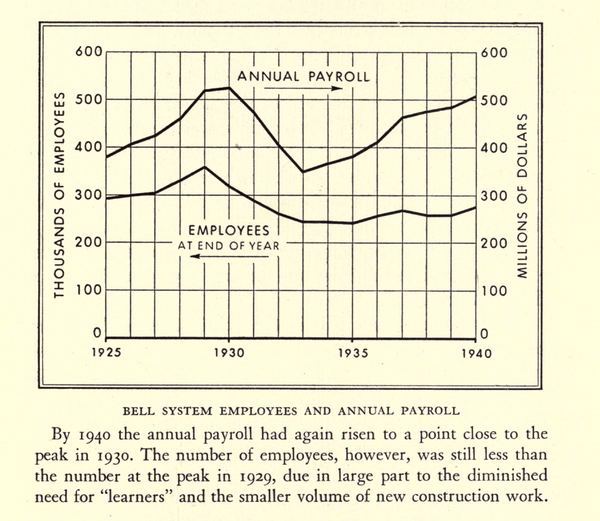
Payroll growth

CEOs worked their way up

Conversations per person
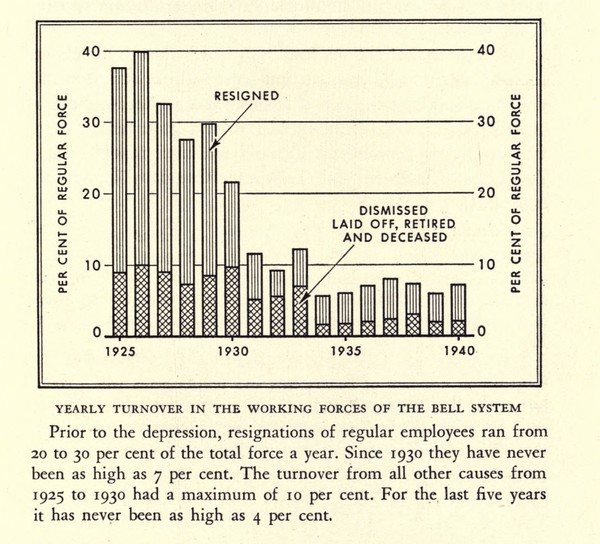
Employee turnover

Effect of the depression
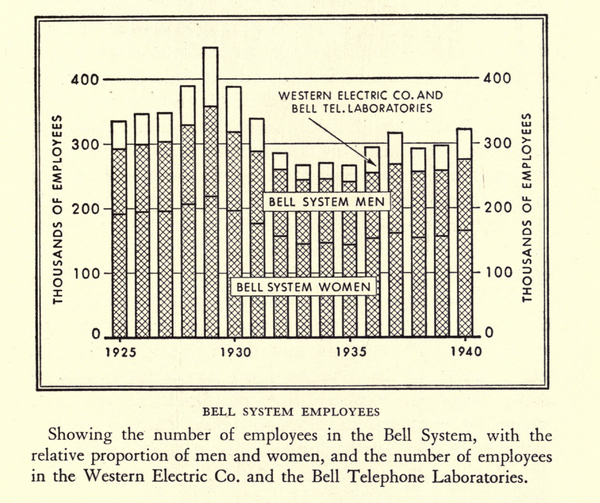
Male vs female employees
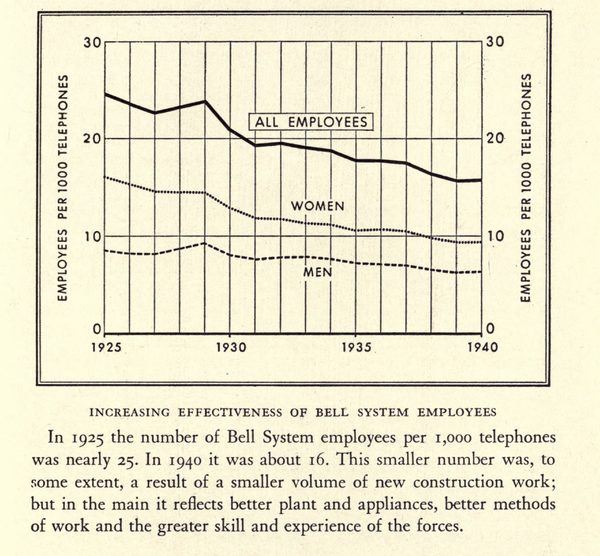
Employee effectiveness (per telephone)
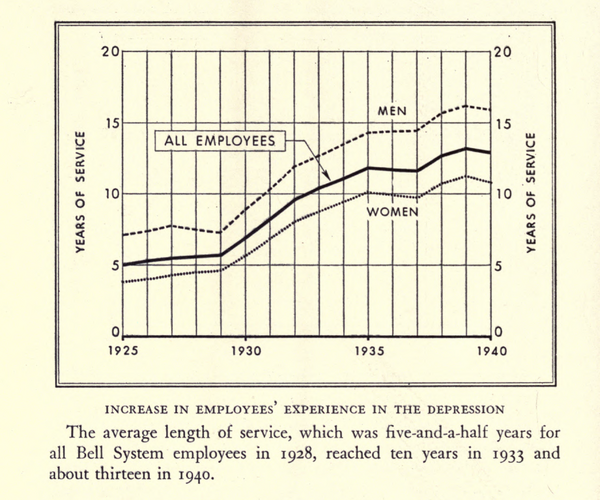
Employee longevity
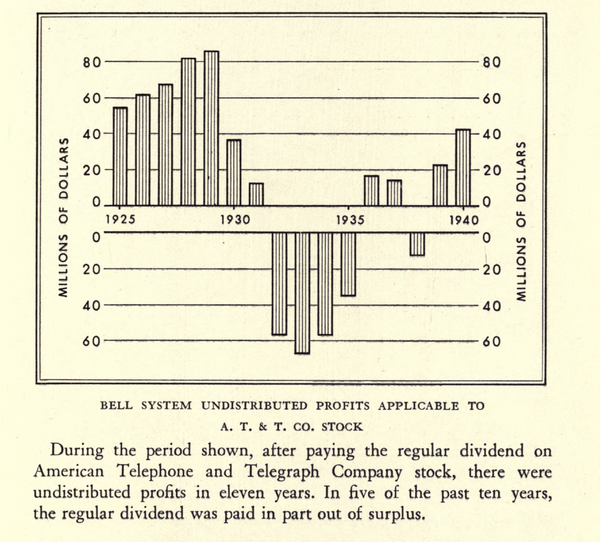
Retained earnings

Revenues expenses and dividends
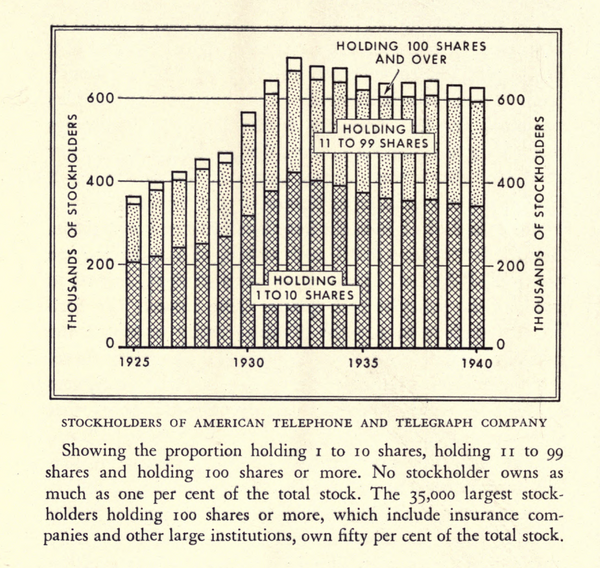
Shareholder distribution
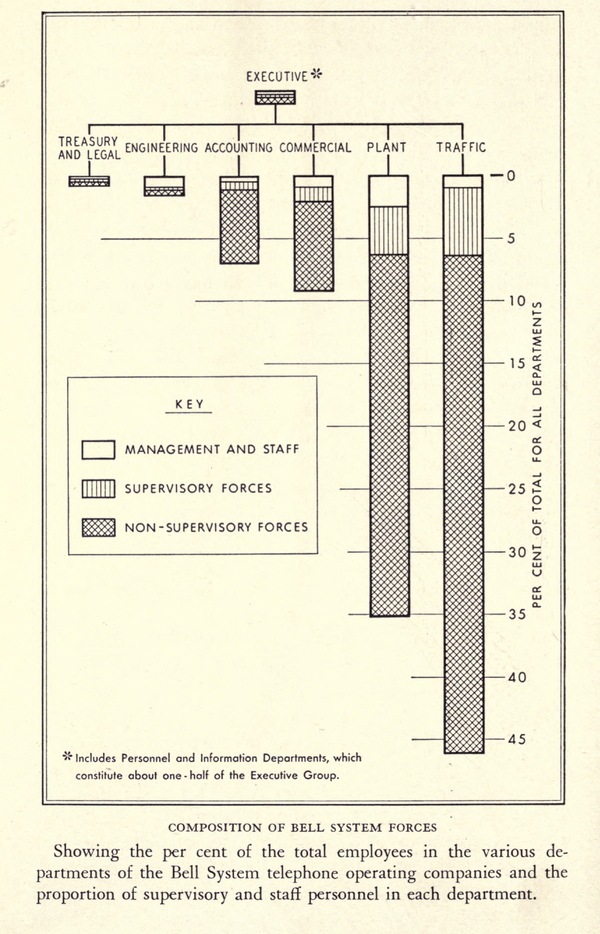
Staff by function
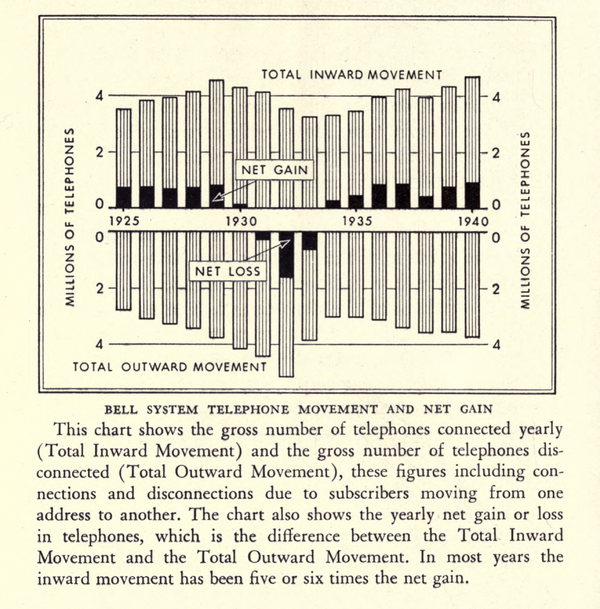
Connections and disconnections

Plant investment per telephone
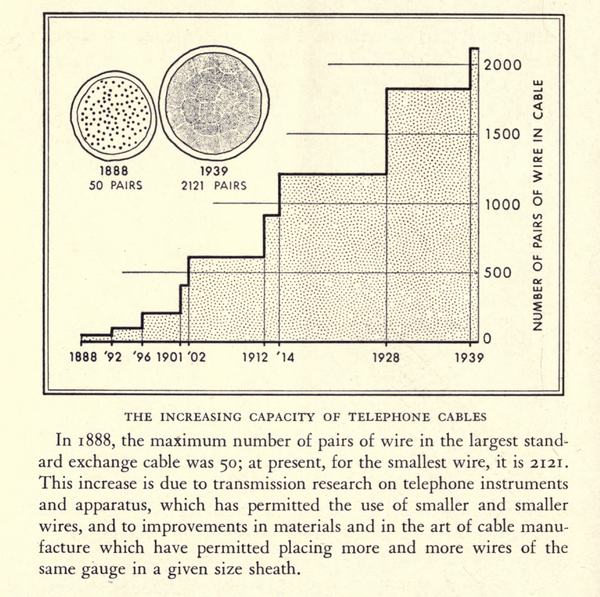
Telephone cable capacity
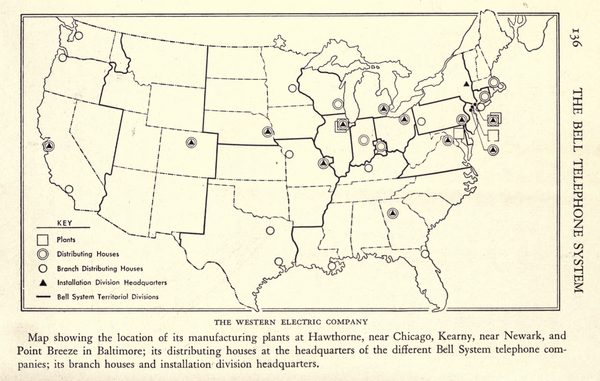
Factory locations
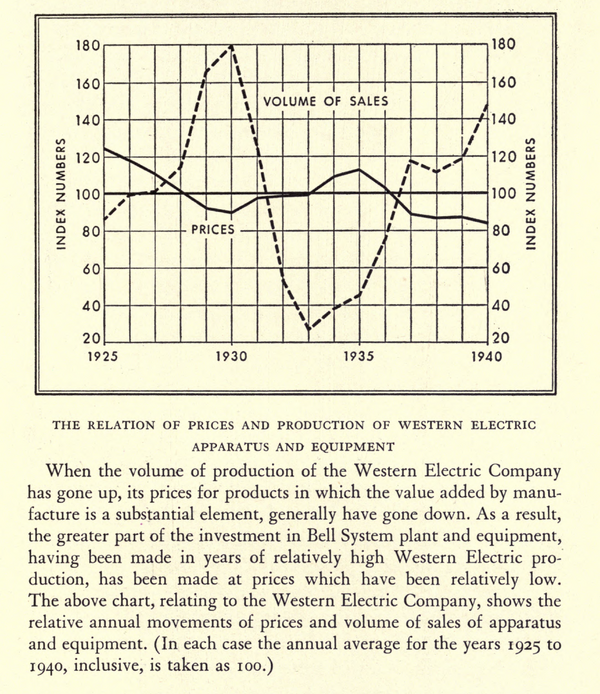
Price vs. volume

Long Lines return on capital
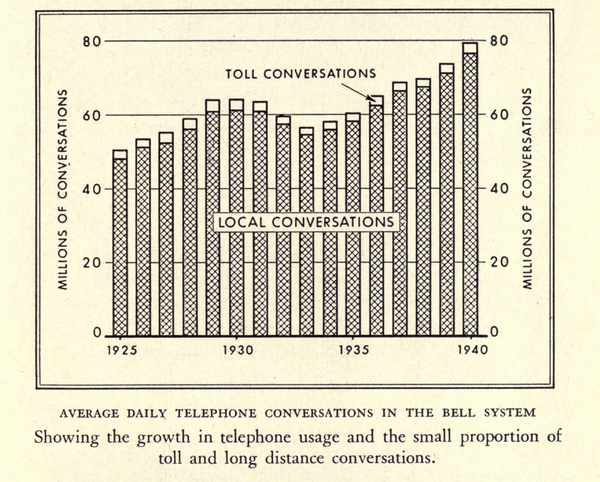
Conversation growth

Local vs toll revenues

Stats by subsidiary
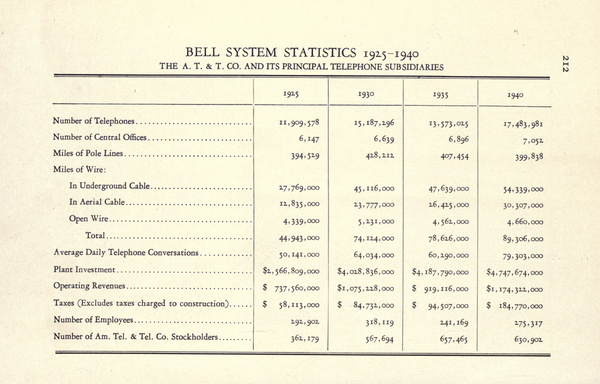
Summary stats page
Images from The Bell Telephone System 1925-1940